DSL to describe Risks
In an increasingly complex world, risks don't appear in isolation — they are interconnected, generating situations that are difficult to anticipate using traditional methods.
This project introduces an interactive web application that combines probabilistic models with visual diagrams, allowing users to represent uncertainty scenarios in a clear and intuitive way. Through a visual DSL built with Angular and TypeScript, anyone can transform abstract statistical calculations into understandable diagrams, with no advanced technical knowledge required.
The tool is designed for critical sectors such as space missions, banking and insurance, where making informed decisions can make a significant difference. Explainability and simulation (what-if scenarios) are a great gain to explore better and worst scenarios.
The goal is simple: to bring risk modelling closer to analysts and management teams, merging the rigour of data with the clarity of visuals, so that any organisation can understand its risks and act with greater confidence and security.
Binomial Examples
What it is used for
It models sequential processes in which events occur in a chain, each with an independent probability of success or failure. It answers questions such as 'What is the probability that an order will reach the customer if each link in the chain can fail?' or 'What is the probability that a drug will pass all phases of clinical trials?'
How it is built
The diagram is a graph of nodes (start, state, event, end) linked by connections with weights. Each weight represents the probability of taking that branch. The theoretical probability of reaching a result is calculated by multiplying the probabilities along the path. In addition, a simulation engine traverses the graph many times (the iterations) and measures how often success is achieved, allowing the theoretical value to be compared with an empirical one.
Why it has been used
The binomial approach fits naturally with risks that break down into successive success/failure steps. It is intuitive — the diagram is read from left to right —, easy to parameterise using historical data (failure rates per stage) and sufficient for a huge variety of real-world cases: quality control, supply chains, attack chains in cybersecurity or the phased funnel of a clinical trial. The simulation also provides empirical validation of the calculations.
Examples
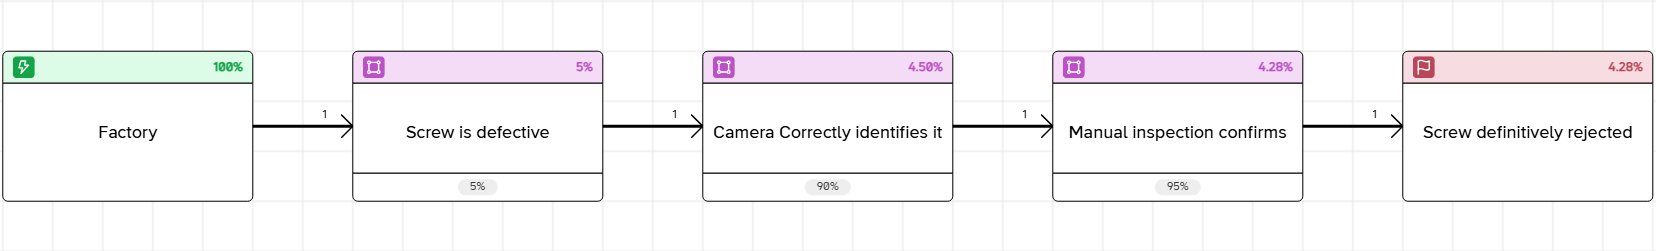
Example 1. In-line Quality Control
A factory produces screws on an automated production line. The quality control process consists of two stages: first, an automatic visual inspection (using a camera), and then, only if the camera detects a defect, a manual inspection by an operator. Historical data shows that:
- 5% of the screws are defective.
- The camera correctly identifies 90% of the defective screws (true positive rate).
- If a screw is referred for manual inspection, the operator confirms the defect 95% of the time.
The aim of the model is to estimate the probability that a screw will be definitively rejected after passing through the entire process.
 Open this example in the model →
Bayes Examples
What it is used for
It models causal networks in which various variables influence one another, and allows for reasoning based on partial evidence: by observing the state of some nodes, the network updates the probabilities of the rest. It answers questions such as 'if an engine failure is detected during flight, what is the probability of reaching orbit?' or 'if the abort alarm went off, what is the probability that the failure is real?'.
How it is built
It is a Bayesian network: a directed acyclic graph where each node has a Conditional Probability Table (CPT) that describes its probability as a function of its parents' states. The inference engine calculates the marginal distributions for each node. Exact inference enumerates the actual combinations and is limited to 20 nodes due to its exponential cost. Above that size, Monte Carlo (likelihood weighting) is used for an approximate estimate with its margin of error. CPTs can be defined manually or learned from CSV's data.
Why it has been used
Many real-world risks are not simply linear chains: causes interact, there are external factors (e.g. weather or sea conditions) and, above all, we have partial observations on which to base our reasoning. Bayesian networks are the standard formalism for this: they clearly separate a sensor's sensitivity from its false positive rate, propagate evidence throughout the network, and allow for both forward (effect) and backward (cause) reasoning. This makes them ideal for scenarios such as the reliability of space missions or alarm diagnosis, where what matters is not just detecting an event but estimating its true significance.
Examples
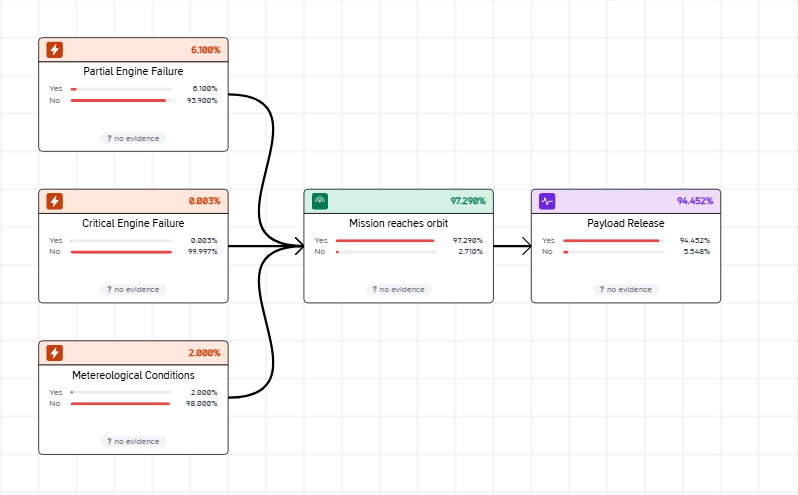
Example 1. Falcon 9 Mission
This example demonstrates how a Bayesian network can help estimate the risk of an aerospace mission based on partial evidence. The case is inspired by the Falcon 9, whose first stage is equipped with nine Merlin engines and is designed with engine-out capability: it can continue the mission even if one or two engines fail during ascent. The question the model answers is:
If an engine failure is detected during flight, what is the probability that the mission will succesfully reach orbit?
To avoid an overly large network, the model does not represent the 9 engines separately. If each engine were modelled individually, 2^9 = 512 possible combinations would have to be considered, which would make the probability tables difficult to manage in an interactive example.
To avoid having to manually enter the 9 engines into the network, the probability of 0, 1, 2 or more engines failing is calculated in advance using a binomial distribution.
In this case, two parameters are used:
- Number of engines: 9
- Probability of failure per engine: 0.7 %
Using these values, the model calculates the probability that no engines will fail, the probability that 1 or 2 engines will faily, and the probability that 3 or more engines will fail.
The model consists of five main nodes:
- Partial Engine Failure: 1 or 2 engines fail. The mission can still succeed.
- Critical Engine Failure: 3 or more engines fail. The mission is likely to fail.
- Meteorological Conditions: Adverse weather can affect the mission's success.
- Mission reaches orbit: The mission successfully reaches its intended orbit.
- Payload release: The payload is successfully released once the mission reaches its target orbit.
Simplifying the engines allows the probabilistic logic of the real system to be retained without overcomplicating the model. Rather than manually entering hundreds of combinations, the binomial calculation summarises the probability of a partial or critical failure, and the Bayesian network is responsible for propagating that risk through the rest of the model to estimate the overall mission risk based on the evidence of an engine failure.
The model's structure reflects a simple decision chain: engine failures and weather conditions influence the probability of reaching orbit, and, in turn, reaching orbit determines the probability of succesfully deploying the payload.
This case illustrates the value of the Bayesian approach within the DSL: the user can see how the risk changes when new evidence is introduced. A partial failure does not automatically imply mission failure, but it does reduce the margins of success. Conversely, the combination of several adverse factors can significantly degrade the probability of success.
Probabilities defined in the CPTs
Each node in the network has an associated probability table. In root nodes, the table defines their initial probability. In dependent nodes, the CPT indicates how the probability changes according to the state of their parent nodes.
Root nodes
| Node | State | Probability | Meaning |
|---|---|---|---|
| PartialEngineFailure | Yes | 6.1% | 1 or 2 engines fail. |
| PartialEngineFailure | No | 93.9% | No partial failure occurs. |
| CriticalEngineFailure | Yes | 0.0030% | 3 or more engines fail. |
| CriticalEngineFailure | No | 99.9970% | No critical failure occurs. |
| WeatherConditions | Yes | 2.0% | Adverse weather during the flight. |
| WeatherConditions | No | 98.0% | Weather conditions are favorable. |
Intermediate node: MissionReachesOrbit
| PartialEngineFailure | CriticalEngineFailure | WeatherConditions | P(Mission = yes) |
|---|---|---|---|
| No | No | No | 98.5% |
| No | No | Yes | 80.0% |
| No | Yes | No | 5.0% |
| No | Yes | Yes | 1.0% |
| Yes | No | No | 85.0% |
| Yes | No | Yes | 55.0% |
| Yes | Yes | No | 2.0% |
| Yes | Yes | Yes | 0.5% |
The last two rows combine a partial failure and a critical failure at the same time. In reality these are almost incompatible situations, but they are included to complete the binary table required by the model.
Leaf node: PayloadDeployed
| MissionReachesOrbit | P(Payload = yes) |
|---|---|
| Yes | 97.0% |
| No | 3.0% |
These CPTs are what the network uses to update the probabilities when the user introduces evidence. For example, if a partial engine failure or adverse weather is confirmed, the model selects the corresponding rows and propagates the change toward the mission and payload deployment nodes.
Open this example in the model →Credits


My name is Juan José Amores, a Computer Engineering student at UPV(Technical University of Valencia), specializing in Software Engineering. What drives me is building technology that goes beyond the technical: tools that help people understand complex problems and make decisions with greater clarity and confidence.
That idea is what gave rise to this project. My final degree thesis —Visual Modeling and Risk Calculation using DSL and Web Technologies— is a web application that allows users to represent, calculate, and explore risks through interactive visual models. By combining a custom DSL, probabilistic networks, and integration with Daga, the tool transforms complex calculations into dynamic, easy-to-understand diagrams that are simple to manipulate.
This project was developed in collaboration with Metadev and under the supervision of Pedro J. Molina, PhD. and Patricio Letelier, PhD., which allowed me to work in a real professional environment from the early design stages all the way through to the final implementation.
To build it, I worked with Angular, TypeScript, and web diagramming libraries, bringing together software engineering, probabilistic calculus, and user experience design. The goal isn't just to build a working application — it's to bring risk analysis closer to real-world contexts such as space missions, banking, insurance, and investment.
Ultimately, this project represents my way of merging curiosity, technology, and practical value. Turning hard-to-interpret mathematical models into visual tools that help teams and organizations make better decisions.
Learn more
To learn more, below you have a link to download the TFG thesis report. Please note that it is written in Spanish.
Download the TFG thesis report (PDF, in Spanish)